


Payments Trends Impacting Your Office’s Financial Health
Managing an office comes with its unique challenges, and staying informed of industry trends is essential to ensuring financial stability. While each office operates differently, understanding prevalent trends can offer valuable insights into your practice’s financial health.
Here, we delve into key payment trends affecting office managers and provide actionable insights for maximizing profitability.
Navigating Payment Landscape Shifts
In recent years, the landscape of payment processing has undergone significant transformations, driven by evolving consumer preferences and technological advancements. Amidst these changes, it’s crucial for office managers to stay informed about how payment trends have impacted their bottom line.
Best Card, the endorsed payment processor of the ADA Member Advantage and 50+ dental and mental associations has been working with thousands of dental offices nationwide for over 15 years, and we aim to shed some light on pertinent questions often overlooked by office managers:
- Average Credit Card Payments: How does your office’s credit card processing volume compare to industry averages?
- Price Adjustments: Has your office adjusted service fees to offset inflationary pressures?
- Payment Processing Costs: What are you actually paying to process credit cards at the practice? Learn to calculate the effective rate you are paying, and discover what is reasonable for this, and how it impacts your bottom line.
Understanding these dynamics can empower office managers to make informed decisions and optimize financial performance.
How Much Does the Average Dental Office Collect in Credit Cards?
Dental offices have seen a large increase in the total amount of credit card payments collected over the past 10+ years and Covid accelerated that trend considerably, as patients moved towards payment methods that were more convenient and involved less physical contact. Furthermore, many insurance providers started issuing virtual credit cards as payment for their remittances, which also increased the number of card payments dental practices are accepting.
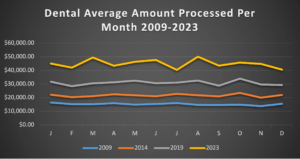 In 2023, the average dental office ran $44,925 in credit card payments per month.
-
- That’s a 45.5% increase over the 2019 average of $30,876.
- It’s a 195% increase over the 2009 average of $15,221. The average practice is now running almost 3 times as much in credit cards as in 2009!
While accepting credit cards ensures that offices can quickly and easily collect payments, with more patients and insurance providers choosing to pay with cards, it is a much more substantial factor in the practice’s bottom line than in the past.
Have Practices Raised Their Costs to Keep Up with Inflation?
Every office manager understands that the challenges brought by Covid, including disruptions in the supply chain and inflationary pressures, have led to increased operational costs. Consequently, many offices across various industries have found it necessary to adjust their pricing strategies in order to offset these rising expenses.
This trend is evident when analyzing the average payment size across different practices.
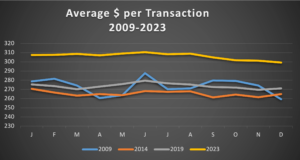
- In 2023, the average credit card payment accepted by dental offices was $306 compared to $273 in 2019 – an increase of 11.87% in just four years.
- From 2009 to 2019, the average payment only increased 0.12% over a 10-year period.
- 2023 saw a slight decrease in the average payment compared to 2022: from $307 to $306, indicating that increases due to inflation may be slowing.
The Consumer Price Index shows that inflation in the U.S. from 2019 to 2023 was 19.2%, so even though the increase in average dental transaction size from 2019 onward marked a substantial difference compared to 2009-2019, the 11.87% increase hasn’t kept up with the economy-wide price hike.
What Does the Average Practice Pay to Run Cards?
At the same time that the average dental office’s payment volume has increased, the costs incurred to run those payments has also increased, and often these fees can be hard to understand. What’s easy to discern, however, is the impact on the bottom line of the practice.
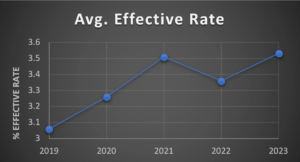
To figure this out, you should calculate your effective rate with some simple math on a recent statement:
Total Fees Paid ÷ Total Dollars Processed = Your Effective Rate for the Month
In 2023, the average dental office in the U.S. paid 3.53% compared to 3.06% in 2019. These rates are already too high, but to put it in perspective, back in 2014, the average dental office paid 2.84%.
So, the average office is paying more as a percentage while also accepting 45% more card payments than they did back before the pandemic. That makes a big difference.
Put in real numbers:
- The average office in 2019 ran $30k at a rate of 3.06% for a total of $944 per month in fees.
- The average office in 2023 ran $45k in card payments, and is now paying 3.45%, for a total of $1,585 per month in fees.
- For the average practice, that’s an increase of $ 7k per year in costs over just 4 years.
While the average office paid 3.53% in 2023, Best Card’s average dental office on the exclusive rates offered to ADA Members paid 2.22% in 2023 for an average savings of $6,496 per year.
Summary
As office managers, your days are filled with countless responsibilities, making it easy to overlook small increases in the costs of services you are using. Often, those small increases are frequent enough to have an eventually big impact.
Any part of your business that increases substantially over time should be analyzed periodically to make sure that it’s meeting the needs of your bottom line. If you see that you’re paying more to accept credit cards while also taking more payments, it might be time to look for a better option.
To find out what Best Card might be able to save your practice, send us a recent monthly statement and we can do a complimentary cost analysis to show you exactly what your practice could be saving.
- Phone: (877) 739-3952
- Email: Compare@bestcardteam.com
- Fax: (866) 717-7247
About Our Sponsor:

Phil Nieto is the President of Best Card, the endorsed credit card processor of the ADA Member Advantage. He enjoys working with thousands of dental offices to help minimize the headaches of accepting card payments by focusing on providing what the merchant services industry often lacks: innovation and integrity. On the rare opportunities for a quiet moment, he loves spending time with his wife and kids.
Cited Sources:
1. Author, U.S. Bureau of Labor Statistics, (December 2019 – December 2023). CPI Inflation Calculator. Retrieved from [U.S. Bureau of Labor Statistics].
2. Author, Federal Reserve Bank of Minneapolis, (1913-Present). Inflation Calculator. Retrieved from [Inflation Calculator, Federal Reserve Bank of Minneapolis].
3. Best Card (December 2019 – December 2023). Average Effective Rate Dec. 2019_Dec.2023. Best Card. Retrieved from [Processing Volume Report 2008-2024].
4. Best Card (2009 – 2023). Average Payment Amount Per Transaction 2009-2023. Best Card. Retrieved from [Processing Volume Report 2008-2024].
5. Best Card (2009 – 2023). Average Amount Processed Per Month 2009-2023. Best Card. Retrieved from [Processing Volume Report 2008-2024].